
 Insights & Tips
AI Apps to Build Without Coding: 10 Useful Ideas in 2026
Ten practical no-code AI app ideas for companies, the criteria for choosing a tool, and the signals that it is time to build custom.
JorgeAugust 8, 2026Read the article
8 KPI dashboard examples with copyable card templates and design rules. See how fast prototypes and low code AI build real dashboards your team will use.

This article gives you working KPI dashboard examples, organized by department and industry, plus copyable card templates and the design rules that separate a dashboard people actually use from one they ignore. Pick the example that matches your team’s decisions, borrow its metric list, then apply the layout and color rules in the sections below to make it decision ready.
TL;DR:
The most effective KPI dashboards focus on the specific decision they need to support, starting with clear decision statements before choosing metrics.
Limit the top-level view to three to five core metrics, with supporting metrics accessible through drilldowns, and use color strictly for status indicators.
Automate data collection and validation processes to ensure accuracy and keep dashboards relevant, revisiting them regularly to prevent outdated insights.
Use proven template libraries from Power BI, Tableau, or Google Sheets, and adapt them by mapping, wiring, and validating live data sources.
Dashboards that directly influence decision-making tend to be used consistently, especially when integrated into weekly routines and aligned with real-time or scheduled updates.
A KPI dashboard pulls key performance indicators from your systems and displays them as charts, cards, and tables so a team can review performance without digging through spreadsheets. It unites separate data sources into one visual feedback loop, showing at a glance whether the numbers are moving in the right direction. Analysts, department heads, and executives use them the same way a pilot uses a cockpit display: not for deep analysis, but for a fast read on whether something needs attention.
Not every dashboard should look the same, because not every audience needs the same thing. Four purposes cover most business use cases:
Before you build anything, ask which of these four you’re actually making. An executive who wants a five-second health check will ignore a dashboard built for an analyst’s drilldown, and an analyst forced into a three-metric executive view will just export to Excel anyway.
Dashboards organized by department and industry help teams skip the blank-page problem and start with metrics that are already proven to matter for that function. Below are eight ready-to-adapt examples with the metrics, cadence, and primary decision each one supports.
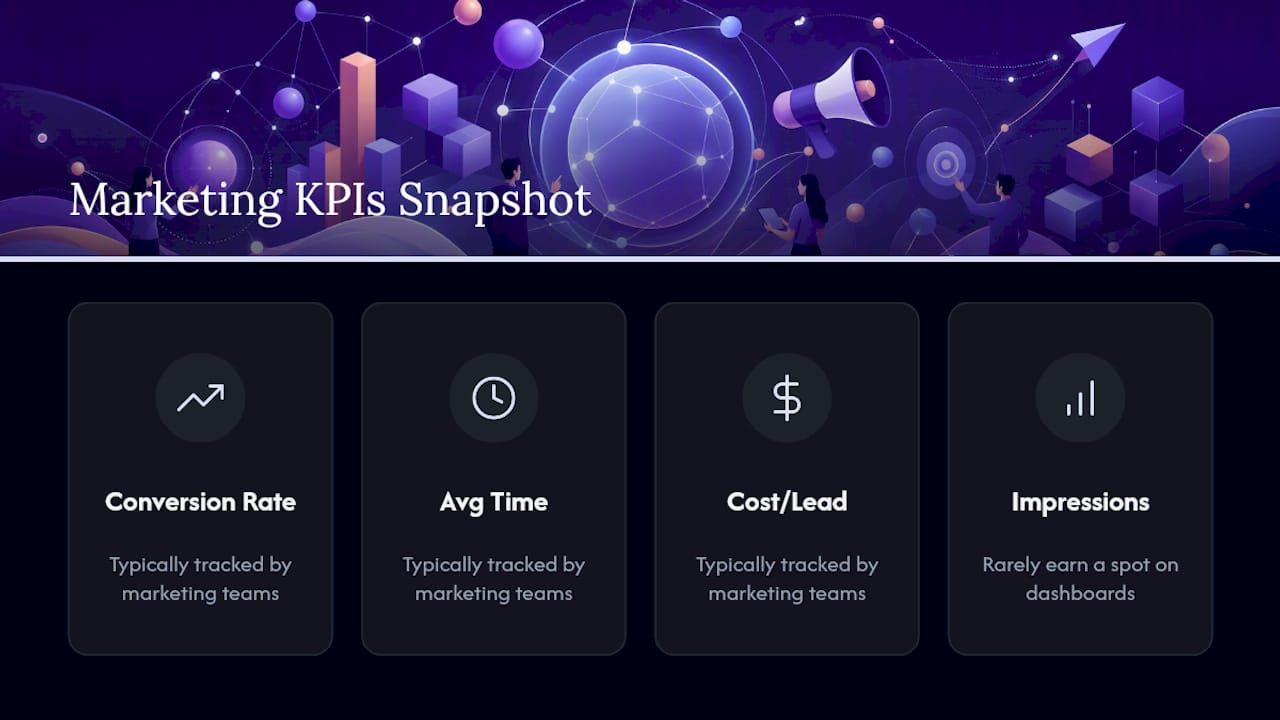
Marketing teams typically track conversion rate and average time on page alongside cost per lead, marketing qualified leads (MQLs), channel mix, email open rate, and customer acquisition cost (CAC). Review weekly to decide budget reallocation across channels. A deeper breakdown of which specific metrics belong on a growth marketing dashboard, and why vanity metrics like impressions rarely earn a spot, is covered in this growth marketing KPI framework.
Core metrics include CSAT and first response time, plus average resolution time, ticket backlog, first-contact resolution rate, and agent utilization. Support leads check this daily; it drives staffing and escalation decisions in real time.

Finance teams anchor on profit and loss and operating cash flow, adding gross margin, burn rate, days sales outstanding, and budget variance. Reviewed monthly by finance and quarterly by the board, this dashboard supports runway and investment decisions.
IT dashboards track mean time to repair and server downtime, along with uptime percentage, ticket volume, incident count, and deployment frequency. Ops teams watch it continuously; it supports on-call staffing and infrastructure investment.
Track pipeline value, win rate, average deal size, sales cycle length, quota attainment, and lead-to-opportunity conversion. Sales managers review weekly to decide where reps need coaching or pipeline support.
Keep this one lean: revenue vs. target, gross margin, net new customers, cash runway, and headcount. Reviewed monthly or at board meetings, it exists purely to answer “is the company on track.”
Track conversion rate, average order value, cart abandonment rate, return rate, and revenue per visitor. Reviewed daily during peak season, it drives merchandising and promotion decisions.
Monitor monthly recurring revenue (MRR), churn rate, activation rate, daily/monthly active users, and net revenue retention. Product and growth teams review weekly to prioritize the roadmap.
A KPI card format works across all eight: metric name, current value, delta versus the prior period with an arrow, a small target marker, and an inline sparkline. For example, a customer service card might read “First Response Time: 2.4 hrs (down 18% vs. last week, target 3 hrs)” with a seven-day trend line underneath. That single card tells a support lead everything needed for a go/no-go staffing call without opening a report.
Every dashboard on the list above starts the same way: with a decision, not a metric wish list. Dashboards built to answer a specific question outperform ones assembled by asking “what should we track”, because the metric selection follows naturally once you know what someone needs to decide. Write your one or two decision statements first: “Should we shift ad spend between channels this week?” or “Is support staffing adequate for next month?” Every metric on the dashboard should trace back to one of those questions.
From there, apply a strict hierarchy instead of dumping every available number onto one screen. ClearPoint Strategy recommends three tiers: a north-star tier of 3 to 5 metrics that define success, a supporting tier of 8 to 12 metrics that explain the north-star, and everything else pushed behind a drilldown. This structure keeps the top-level view scannable while still letting analysts dig deeper when a number looks off.
Color needs the same discipline. Reserve red, yellow, and green strictly for status, and use neutral blues or grays for everything else, since consistent color use can cut interpretation time by as much as 40 percent. One rule trips up more dashboards than any other: invert the color logic when a lower number is better. A support dashboard showing average resolution time should turn green as the number drops, not red, because red at the top of a chart reads as “bad” by instinct regardless of what the metric actually measures.
Pro Tip: Set a fixed review cadence for every dashboard, and write it on the dashboard itself. A card that says “Reviewed weekly, every Monday” prevents the slow rot where a dashboard gets built, checked twice, then quietly ignored for the next two quarters.
A dashboard layout that scales from five metrics to fifty follows a predictable shape. Modern dashboard design puts a strip of 4 to 6 KPI cards across the top, pairs of related charts in the middle, and a detailed data table at the bottom, all fit onto a 12-column grid. Products like Stripe, Linear, and Vercel use variations of this same pattern for a reason: it puts the headline numbers where the eye lands first and pushes detail down for people who want it.
Each KPI card follows a three-part anatomy: a large current value, a small delta with a directional arrow, and an inline sparkline showing recent trend. Chart pairings matter too. A trend line next to a category breakdown answers “is this moving, and why” in one glance; a funnel next to a cohort chart does the same for conversion problems.
| Grid row | Column span | Component |
|---|---|---|
| Row 1 | 12 columns, 4-6 cards | KPI card strip (value, delta, sparkline) |
| Row 2 | 6 + 6 columns | Trend line paired with category breakdown |
| Row 3 | 4 + 8 columns | Filter panel plus detailed data table |
Filters, date range pickers, and segment toggles belong in a persistent sidebar or a slim filter row, never buried inside a chart. Drilldowns should feel like a natural extension of the click, not a separate report the user has to go find, and alerts (a metric crossing a threshold, a target missed three periods running) work best as a small badge on the card itself rather than a separate notification feed.
Each KPI card needs four fields to be useful: a formula, a target type, a data source, and a naming convention that won’t drift as your team grows. Here are five templates ready to adapt directly.
last month" reads clearly, while an unlabeled delta invites guesswork. Keep a shared naming document for every metric definition so “conversion rate” means one specific formula company-wide, not five slightly different calculations across five spreadsheets.
Power BI, Tableau, and Google Sheets each publish free KPI dashboard templates worth starting from rather than building from a blank canvas. Power BI’s template library suits teams already on Microsoft’s stack, Tableau’s gallery fits data teams needing heavier customization, and Google Sheets templates work best for smaller teams that need something running in under an hour. Vendor template libraries exist precisely so teams don’t have to build the visual structure from scratch, letting you focus effort on getting the data right instead of the layout.
Adapting any template comes down to three steps:
Before rollout, run a short checklist: every field mapped correctly, every target sanity checked against last quarter’s actuals, and automation confirmed to refresh on schedule rather than requiring a manual export every week.
Kreante has delivered more than 265 projects across 35 countries, and a recurring theme across that work is teams that had plenty of data but no dashboard that actually drove a decision. The consult-prototype-build process starts with a working prototype in weeks, not months, so a client sees a real dashboard against real data before committing to the full build.
This article’s editorial perspective comes from Jorge Del Carpio, whose case studies on measurement-driven builds are referenced throughout Kreante’s project library.
A KPI dashboard tells you what happened. It doesn’t tell you why, and that’s the most common misread in daily use. Before reacting to any number, check three things: the trend direction over multiple periods (not just versus yesterday), the comparison baseline (is this versus last week, last month, or a fixed target), and whether the change sits inside normal variance or represents a real shift.
A single day’s dip in conversion rate usually means nothing. The same dip sustained across two weeks, paired with a rising cart abandonment rate on the same dashboard, tells a different story. Cross-referencing related metrics on the same screen catches problems a single number hides. If support ticket volume rises but CSAT stays flat, that’s a capacity story, not a quality story, and the fix looks completely different depending on which one it is.
Watch for correlation traps too. Two metrics moving together doesn’t mean one caused the other. Revenue and headcount both rising during a hiring push looks like a growth story, but the real driver might be a seasonal spike that would have happened regardless of hiring. Segment before concluding: break a company-wide number down by channel, region, or customer cohort before deciding what the overall trend actually means, since an aggregate can hide two opposite trends canceling each other out.
Finally, treat targets as living numbers. A target set a year ago against different market conditions can make a genuinely good result look like a miss, or a mediocre one look like a win. Revisit targets on the same cadence you revisit the dashboard itself.
The most common failure is metric overload. A dashboard with 40 numbers on one screen doesn’t inform a decision; it just delays one, because nobody can hold 40 numbers in their head long enough to act on any of them. The fix is the tiered hierarchy covered earlier: 3 to 5 north-star metrics visible, everything else behind a click.
The second failure is building the dashboard before defining the decision it serves. Teams often start with “what data do we have” instead of “what do we need to decide,” and end up with a dashboard full of numbers that are easy to pull but useless for actually choosing anything. If you can’t name the decision a chart supports, cut the chart.
Stale or unvalidated data causes damage that’s hard to see until it’s too late. A dashboard connected to a data source that silently broke two weeks ago still looks authoritative, and a manager making a call off broken numbers usually doesn’t find out until the decision has already gone wrong. Automated refresh with a visible “last updated” timestamp catches most of this.
Color misuse is subtler but just as costly. A dashboard that uses red and green decoratively, rather than for actual status, trains viewers to ignore the color coding entirely, which defeats the entire point of using color as a fast visual signal in the first place.
Last, dashboards that never get revisited become expensive decoration. A metric list built for last year’s priorities doesn’t automatically stay relevant, and a quarterly audit of whether each dashboard still maps to a live decision keeps the whole system honest instead of accumulating dead screens nobody opens.
The difference between a dashboard that gets built and one that gets used usually comes down to whether it changed a specific decision within its first month. A support team that adds a first-response-time card with a clear target, reviewed every Monday, tends to see staffing conversations shift from gut feel to a number everyone agrees on. That’s a small change, but it’s the kind that compounds: once a team trusts one number, they start asking for the next one.
The same pattern shows up in growth teams. A marketing dashboard that surfaces cost per lead by channel, refreshed automatically rather than pulled manually each week, turns a monthly budget debate into a five-minute conversation because the data is already agreed upon before the meeting starts. The framework covered in Kreante’s growth marketing KPI resource walks through exactly which channel-level metrics tend to produce that shift.
The pattern that fails, consistently, is the dashboard built for a presentation rather than a decision. It looks polished, gets shown once in a leadership meeting, and then nobody opens it again because it was never wired into anyone’s actual weekly workflow. A dashboard’s real test isn’t how it looks in a demo. It’s whether someone still checks it unprompted three months later.
If your team needs a measurement stack built around a real decision rather than a slide, Kreante’s AI solutions team builds the automation, data wiring, and dashboard together as one working system, starting with a prototype in weeks rather than a lengthy spec process.
Most KPI dashboard advice treats the visual layer as the hard part: the color rules, the card design, the grid. That’s the easy part. The hard part is admitting most dashboards fail not because they look bad, but because nobody ever wrote down the decision they were supposed to support. I’d argue the entire industry-and-department gallery approach, useful as it is, has trained people to shop for a dashboard the way they’d shop for a template, rather than starting with their own decision and building backward.
The overrated piece of conventional wisdom is the idea that more automation alone fixes dashboard adoption. Automated data refresh matters, but a perfectly automated dashboard answering the wrong question still gets ignored. What actually gets used is a dashboard whose owner can say, in one sentence, what decision it changes and how often.
If you take one thing from this gallery, take this: pick your example, then delete every metric on it that doesn’t map to a decision you’ll actually make this month. A shorter, decision-tied dashboard beats a comprehensive one nobody opens.
— Jorge Del Carpio
Keep the top-level view to 3 to 5 north-star metrics, with 8 to 12 supporting metrics available one click away through a drilldown.
Start with an executive or operational dashboard covering revenue, cash flow, and one department-specific metric relevant to your biggest current bottleneck, whether that’s sales pipeline or support response time.
Yes, in most cases. Marketing, finance, customer service, and IT each track different decisions on different cadences, so a shared dashboard usually ends up too generic to drive any single team’s choices.
Match the update cadence to the decision: operational dashboards benefit from daily or real-time refresh, while executive dashboards typically update weekly or monthly.
Start from a template in Power BI, Tableau, or Google Sheets, map your real data fields to its placeholder metrics, wire in a live connection, and validate targets before rollout.
Go further
Don't let your tech watch stop here. Explore our other resources to master your technology stack.
Insights & TipsTen practical no-code AI app ideas for companies, the criteria for choosing a tool, and the signals that it is time to build custom.
 Insights & Tips
Zero Data Retention guarantees your data is never stored after AI processing. Framework to decide when you need it plus a comparison of Anthropic, OpenAI/Azure, Mistral, OpenRouter, LLM Bay and Infomania.
 Insights & Tips
Dive into the world of Generative AI and discover how it’s reshaping content creation, from its fundamental components and real-world applications to its incredible benefits, challenges, and beyond!