Software Project Estimation: A Practical Guide for Dev Teams
Master software project estimation with proven methods. Use a practical guide to create accurate, defensible estimates and improve team efficiency.
Development
KreanteAugust 11, 20262 months ago
Use a combination approach: pick bottom-up or parametric as your primary method, validate with group techniques like Planning Poker or Wideband Delphi, then wrap everything in a three-point uncertainty model. That combination handles the three failure modes that sink most estimates: missing scope, unchecked optimism, and no historical baseline to anchor against.
Your immediate next step is a two-hour discovery session. Collect a draft Work Breakdown Structure (WBS), pull any historical analogs from past projects, and document your assumptions before you touch a single number.
Every defensible estimate needs three things:
Scope: a decomposed WBS with tasks small enough to reason about individually
Assumptions and confidence: explicit statements about what you are assuming, plus a probability range on the total
Historical baseline: at least one comparable project or velocity data to sanity-check the output
Key Takeaways
Defensible software project estimation requires a combination approach: bottom-up or parametric as the primary method, validated by group techniques and a three-point uncertainty model anchored to historical data.
Point
Details
Use a combination approach
No single method is best; combining bottom-up, parametric, and group techniques consistently improves accuracy.
Apply the PERT formula
Use (O + 4×M + P) / 6 to capture uncertainty and report both 50th- and 90th-percentile estimates.
Keep tasks at a size small enough for accurate estimation, generally within a few days of work
Tasks larger than 40 hours hide sub-tasks with different risk profiles and reduce estimate reliability, so it is recommended to keep tasks small and manageable to improve accuracy.
Kreante applies historical productivity splits and a dual-check review to produce defensible fixed-price and T&M bids across web, mobile, and AI projects.
What are the main software project estimation methods?
Software development effort estimation research is clear on one point: no single method outperforms all others across every context. Combining independent estimates from different approaches consistently improves average accuracy. That’s the starting premise for everything below.
Top-down estimation
Top-down estimation starts from an overall project size or cost and allocates effort downward to components. It’s fast and useful early in a project when you have little detail, but it relies heavily on the estimator’s experience and tends to undercount integration and testing work. Best for: rough order-of-magnitude bids, early feasibility checks, or when a client needs a ballpark before committing to discovery.
Bottom-up estimation (WBS-based)
You decompose the project into individual tasks, estimate each one, then aggregate. This is the most accurate method when requirements are reasonably stable, because errors in individual tasks tend to partially cancel out. The WBS-based approach also forces scope clarity. If you can’t break a feature into tasks, you don’t understand it well enough to estimate it. Best for: fixed-price bids, sprint planning, and any project where the client expects a detailed breakdown.
Analogous estimation
You find one or more completed projects that resemble the current one and scale from their actuals. Accuracy depends entirely on how similar the analog really is and whether you recorded actuals in the first place. Best for: repeat project types (e.g., a third SaaS onboarding module) where your team has clean historical data.
Parametric estimation (COCOMO II-style)
Parametric models use a mathematical formula that takes a size measure (Function Points, SLOC, or story points) and applies cost drivers to produce an effort estimate. COCOMO II, for example, uses an equation of the form Effort = A × Size^B × EM, where EM represents a set of effort multipliers for factors like team capability and platform complexity. The catch: parametric models require calibration to your organization’s historical data or they can be less accurate than a skilled expert working from memory. Best for: large projects with stable requirements and a calibrated model.
Expert judgment
A senior engineer or architect produces an estimate from experience. Fast and cheap, but vulnerable to optimism bias and anchoring. Surveys consistently show expert judgment remains the dominant method in practice, which is partly why optimism bias is so pervasive. Best for: small, well-understood features where the estimator has done the same thing before.
Comparison across key dimensions
Method
Accuracy: early vs. late phase
Input required
Best context
Output type
Top-down
Moderate early, poor late
Low (experience, analogs)
Feasibility, early bids
Cost or effort range
Bottom-up (WBS)
Low early, high late
High (detailed requirements)
Fixed-price bids, sprints
Hours per task, total effort
Analogous
Moderate, depends on analog quality
Medium (historical project data)
Repeat project types
Effort or cost ratio
Parametric (COCOMO II, SLIM)
Moderate early, high late when calibrated
High (size measure + historical data)
Large, stable-scope projects
Effort, schedule, cost
Expert judgment
Moderate at any phase
Low (experience only)
Small features, quick checks
Hours or story points
Combination
High across phases
Medium to high
Most production projects
Effort + confidence range
Decision hints by scenario:
MVP with uncertain scope: start top-down for the bid, then run a bottom-up WBS for each sprint as features solidify
Large legacy modernization: parametric (COCOMO II or SLIM) calibrated to your team’s historical productivity, validated by expert judgment
R&D or exploratory work: time-box it; estimation is unreliable when the problem itself is undefined
Small, predictable feature set: bottom-up WBS with Planning Poker for team buy-in
How do you measure software project size?
Size measurement is the input that feeds every parametric model and gives analogous estimation something to scale from. Getting it wrong here compounds through every downstream calculation.
Function Point Analysis (FPA) counts the functional requirements a system delivers to users: inputs, outputs, queries, internal files, and external interfaces. Each element is weighted by complexity and summed into a Function Point count. FPA is language-independent and maps well to business requirements, which makes it useful for contracts and benchmarking. The downside is time: a thorough FPA on a mid-size application can take days.
COSMIC and Use Case Points are functional size variants. COSMIC (ISO 19761) is better suited to real-time and embedded systems. Use Case Points weight actors and use cases by complexity and apply technical and environmental adjustment factors. Both are more accessible than full FPA for teams without a dedicated measurement specialist.
Source Lines of Code (SLOC) is the oldest size measure and still appears in COCOMO II as an input. It’s easy to count after the fact but nearly useless before coding starts. SLOC also varies wildly by language and coding style, so cross-project comparisons require normalization.
Story points are the dominant sizing unit in Agile teams. They measure relative complexity rather than absolute size, which means they’re team-specific. A story point in one team’s velocity is not the same as a story point in another’s. To convert story points to effort, you need the team’s historical velocity (points per sprint) and a confidence band around it.
Practical conversion note: if your team averages 40 story points per two-week sprint with a standard deviation of ±8 points, a 200-point backlog translates to roughly 5 sprints (10 weeks) at the 50th percentile, and about 6.5 sprints at the 80th percentile. Always translate backlog sizing into schedules using team-specific velocity, never industry averages.
Pros and cons at a glance:
Function Points: language-independent, benchmarkable, maps to business requirements; time-consuming to count, requires training
Story points: fast, team-friendly, drives Agile planning; non-transferable across teams, can’t feed parametric models directly without conversion
SLOC: easy to count post-hoc, feeds COCOMO II directly; useless pre-coding, language-dependent
Use Case Points: accessible, maps to requirements documents; adjustment factors are subjective
What to record in your historical baseline: for every completed project, capture the size measure used, actual effort in person-hours, team composition, technology stack, and the number of defects found post-launch. That data is what turns a generic parametric model into a calibrated one.
How do Planning Poker and Wideband Delphi reduce estimation bias?
Group estimation techniques exist because individual estimates are systematically optimistic. Structured group methods force independent thinking before discussion, which reduces anchoring and social pressure to agree with the loudest voice in the room.
Running Planning Poker
Planning Poker is a consensus-based Agile technique for relative sizing. Here’s how to run it:
The product owner reads a user story aloud and answers clarifying questions.
Each estimator privately selects a card from a Fibonacci-like sequence (1, 2, 3, 5, 8, 13, 20, 40, 100) representing their size estimate in story points.
All cards are revealed simultaneously to prevent anchoring.
The highest and lowest estimators explain their reasoning.
The team discusses, then re-estimates. Repeat until consensus or a majority is reached (usually within two or three rounds).
Record the agreed estimate and any assumptions that drove the discussion.
A typical Planning Poker session covers 10–20 stories per hour. It works best for backlog refinement where relative sizing is the goal, not absolute hours.
Running Wideband Delphi
Wideband Delphi is better suited to complex items where iterative expert convergence matters more than speed:
Distribute the specification to all estimators before the session.
Each estimator produces an independent estimate privately, with assumptions documented.
A facilitator collects and anonymizes all estimates, then displays the distribution.
Estimators whose numbers are outliers explain their reasoning to the group.
Everyone re-estimates independently.
Repeat until the range narrows to an acceptable spread (typically two or three rounds).
The facilitator documents the final estimate, the range, and the key assumptions that drove convergence.
Three-point estimation and the PERT formula
Both Planning Poker and Wideband Delphi produce a point estimate. Three-point estimation forces the team to also capture uncertainty. For each task or feature, collect three values:
O = optimistic estimate (best case, everything goes right)
M = most likely estimate (realistic, normal conditions)
P = pessimistic estimate (worst case, major obstacles)
The PERT weighted formula then produces a single expected value:
The formula weights the most likely estimate four times more heavily than the extremes, which reduces but doesn’t eliminate optimism bias. The standard deviation of the estimate is (P − O) / 6, giving you a confidence range to attach to every number you report.
Combining independent estimates: when two estimators produce different numbers using different methods (say, one uses analogous reasoning and another uses a parametric model), average them rather than picking one. The combination almost always outperforms either individual estimate.
Pro Tip:Before any group session, ask each estimator to write down their estimate privately before the group discussion starts. Even in an informal meeting, this one step breaks anchoring and produces a wider, more honest range of initial inputs.
How do you convert effort into a project schedule and price?
Getting from person-hours to a signed contract involves four steps, and each one introduces assumptions that need to be documented.
Aggregate task-level effort. Sum all WBS task estimates (in person-hours) to get total effort. If you used three-point estimates, aggregate the PERT expected values and separately sum the standard deviations to get a project-level confidence range.
Convert effort to duration via resource loading. Divide total effort by the number of available resources, adjusted for their utilization rate. A developer nominally working 40 hours per week is typically productive on project tasks for 28–32 hours after meetings, code reviews, and administrative work. Divide your total hours by the realistic weekly capacity per person to get calendar duration.
Apply fully burdened cost rates. Multiply person-hours by the fully burdened hourly rate for each role (developer, QA, designer, PM). Fully burdened means salary plus benefits, payroll taxes, overhead allocation, and software licenses. Add any direct project costs: third-party APIs, cloud infrastructure, and testing environments.
Add contingency using the 50/90 technique. The PERT expected value is roughly a 50th-percentile estimate: there’s about a 50% chance the project comes in under that number. To quote a 90th-percentile price (one you’re 90% confident you won’t exceed), add approximately 1.3 standard deviations to the expected value. For a project with an expected effort of 1,000 hours and a standard deviation of 150 hours, the 90th-percentile estimate is roughly 1,195 hours.
Scope of QA (unit tests only vs. full regression suite)
Localization, accessibility, or compliance requirements included or excluded
Which formal estimation tools and models are worth using?
Formal parametric models are powerful when calibrated and dangerous when they’re not. Here’s a practical profile of the main ones.
COCOMO II (Constructive Cost Model) is the most widely cited open parametric model. It takes SLOC or Function Points as input, applies scale factors (team cohesion, process maturity, architecture risk) and effort multipliers, and outputs effort in person-months and schedule in months. COCOMO II is free and well-documented, but its default calibration is based on projects from the 1990s and 2000s. Without recalibration to your organization’s data, it can be off by a factor of two or more.
SLIM (Software Lifecycle Management), developed by QSM, uses a Rayleigh curve model of staffing over time. It’s particularly good at modeling the relationship between schedule compression and effort: compressing a schedule increases effort non-linearly. SLIM requires a commercial license and historical data for calibration.
SEER-SEM (from Galorath) is a knowledge-based parametric model that incorporates a large proprietary database of completed projects. It handles hardware/software co-development and embedded systems better than COCOMO II. Like SLIM, it requires a commercial license and benefits significantly from local calibration.
TruePlanning (from PRICE Systems) focuses on hardware and software cost estimation for defense and aerospace projects. It’s the standard in government contracting contexts where formal cost estimation is a contractual requirement.
Spreadsheets and calibrated templates deserve mention because most small-to-mid-size teams never need a commercial tool.
Machine learning approaches to effort estimation have been researched and can improve predictions when adequate historical data and feature engineering are available, but they require ongoing maintenance and careful validation. They’re worth exploring if your organization has hundreds of completed projects with clean data.
Checklist for choosing an estimation tool:
Do you have at least 20–30 completed projects with recorded actuals? (If not, skip commercial parametric tools.)
Can you afford calibration time (typically 2–5 days of analyst work)?
Does the client or contract require a formal, auditable model output?
Does your team have the skill to interpret model outputs and explain them to stakeholders?
Is transparency more important than speed? (Spreadsheets win on transparency; commercial tools win on speed for large portfolios.)
Comparison of formal models:
Model
Best context
Input required
Calibration needed
Cost
COCOMO II
Large software projects, academic/open use
SLOC or Function Points, scale factors
Yes, strongly recommended
Free
SLIM
Schedule-constrained projects, staffing curves
Size, historical productivity
Yes
Commercial license
SEER-SEM
Embedded, hardware/software, defense
Size, complexity drivers
Yes
Commercial license
TruePlanning
Government/defense contracting
Detailed WBS, complexity
Yes
Commercial license
Calibrated spreadsheet
Small-to-mid teams, transparent bids
Historical rates, WBS
Built-in (your own data)
Free
A step-by-step estimation workflow with a worked example
This workflow maps directly to the practical estimation process of defining size, producing effort estimates, converting to cost, and identifying critical resources.
The eight-step workflow
Discovery. Run a structured session (2–4 hours) with the client and tech lead. Capture functional requirements, constraints, integrations, and non-functional requirements (performance, security, compliance).
WBS decomposition. Break the project into deliverables, then into tasks. Target task sizes of 24–40 hours each; tasks larger than 40 hours are too vague to estimate reliably.
Size measurement. Assign a size measure to each component: story points for Agile backlogs, Function Points for contract-grade estimates, or SLOC for parametric model inputs.
Quantify effort. Apply your chosen method (bottom-up, parametric, analogous) to produce effort estimates per task. Use three-point estimates for any task with high uncertainty.
Capture uncertainty. Aggregate PERT expected values and standard deviations. Document the confidence level of the total estimate (50th vs. 90th percentile).
Aggregate and convert. Sum effort, apply resource loading to get duration, apply fully burdened rates to get cost.
Validate. Cross-check against at least one analog project or a parametric model. If the two outputs differ by more than 30%, investigate before presenting the estimate.
Document. Record assumptions, confidence level, inputs used, historical analogs referenced, and the name of the estimator who owns each section.
Worked example: a three-feature web application
Suppose you’re estimating a web app with three features: user authentication, a dashboard with data visualization, and a CSV export function.
At a fully burdened rate of $120/hour for a mid-level developer, the 50th-percentile cost is $15,480 and the 90th-percentile cost is $19,320. Present both numbers to the client and explain what each means.
Pro Tip:Keep tasks between 24 and 40 hours. A task estimated at 80 hours almost always contains two or three hidden sub-tasks with different risk profiles. Breaking it down takes 15 minutes and usually reveals the real uncertainty.
Why do estimates fail, and how do you improve accuracy over time?
Most estimation failures trace back to a small set of recurring causes. Knowing them doesn’t make you immune, but it does make the remedies obvious.
Common pitfalls:
Optimism bias: estimators consistently underestimate duration and effort, especially for novel work. Three-point estimation is the standard countermeasure.
Unclear scope: tasks that can’t be decomposed into 24–40 hour chunks are a signal that the requirement isn’t understood yet.
No historical data: without actuals from past projects, every estimate is a guess dressed up as a number.
Ignoring non-development work: QA, code review, deployment, documentation, and client feedback cycles routinely add 30–40% to raw development effort and are frequently omitted from early estimates.
Scope creep: requirements added after the WBS is locked invalidate the original estimate without anyone formally acknowledging it.
Poor task granularity: tasks estimated at 80+ hours are too coarse; tasks at 1–2 hours are too fine and create overhead without improving accuracy.
Concrete remedies:
Run a time-boxed discovery session before any estimate leaves the building
Enforce the 24–40 hour task rule in your WBS
Require three-point estimates for any task flagged as high-risk or novel
Maintain a project actuals log: size, effort, team composition, technology, and defect count for every completed project
Add a non-development work line item to every estimate (QA, PM, deployment, client review)
Metrics to track estimation accuracy:
It’s intuitive and easy to calculate from your actuals log.
MMRE (Mean Magnitude of Relative Error) averages the absolute percentage error across all tasks. Lower is better, but MMRE is sensitive to outliers and can be misleading when a few tasks blow out badly. Use both metrics together.
Running estimation post-mortems: after each project closes, compare estimated vs. actual effort for every WBS task. Identify the three tasks with the largest errors and ask why. Feed the findings back into your parametric model calibration and your estimation templates. Teams that do this consistently see measurable accuracy improvements within three to five projects.
Pro Tip:Track PRED(25) by task category (backend, frontend, QA, integration). You’ll almost always find that one category is systematically underestimated. That’s where your calibration effort should go first.
How do you choose the right estimation approach for your project?
The right method depends on four variables: project size and novelty, available historical data, required accuracy at the time of estimation, and how much time you have to estimate.
When to run parallel approaches: any project above $200K or six months in duration warrants at least two independent estimation methods.
Mixing methods defensibly: document which method produced which number, what inputs each used, and how you reconciled the outputs. A client or auditor who asks “how did you get to this number?” should be able to follow your reasoning from inputs to final figure in under five minutes.
How Kreante approaches defensible estimates in practice
Kreante has delivered over 265 projects across 35 countries, which means the estimation process has been stress-tested across a wide range of project types, team configurations, and client expectations. A few proof points that shape the approach:
Projects span web apps, mobile apps, SaaS platforms, marketplaces, and AI-integrated solutions
Delivery includes both fixed-price and T&M engagements, so the estimation process has to support both contract types
The senior-only team structure means productivity assumptions are based on actual senior-level throughput, not blended rates that include junior ramp-up time
Kreante’s stepwise estimation practice:
Discovery session (2–4 hours). A senior engineer and a project lead run a structured session with the client. Output: a draft WBS, a list of open questions, and a first pass at the assumptions log.
Calibrated template. The WBS feeds into a calibrated spreadsheet template that applies Kreante’s historical productivity rates by task category (backend, frontend, QA, integration, deployment).
Dual-check by senior engineer. A second senior engineer reviews the estimate independently, flags tasks that look under- or over-estimated, and documents their reasoning.
Client walkthrough. The estimate is presented with the full assumptions log. The client is walked through the 50th- and 90th-percentile numbers and what each means for their budget and timeline.
Risk buffer policy. For fixed-price engagements, Kreante applies a contingency buffer based on scope clarity: 10–15% for well-defined scopes, 20–25% for scopes with open technical questions, and a T&M recommendation for anything with fundamental uncertainty.
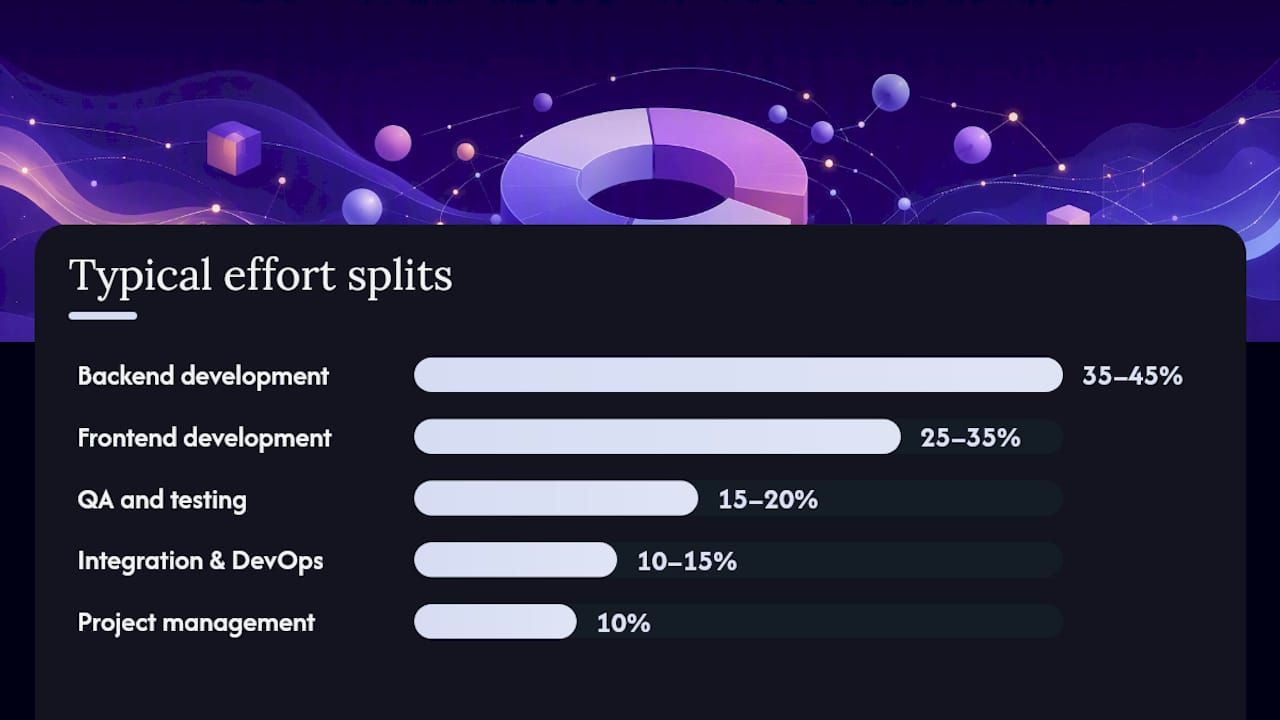
Typical effort splits (based on Kreante’s project history):
Backend development: 35–45% of total effort
Frontend development: 25–35%
QA and testing: 15–20%
Integration, deployment, and DevOps: 10–15%
Project management and client communication: 10%
These splits feed directly into the parametric calibration: when a new project comes in, the WBS is mapped against these categories, and the historical rates per category anchor the bottom-up estimate.
Pro Tip:Ask your client to prioritize features before the WBS is finalized. A ranked feature list lets you produce a tiered estimate (must-have vs. nice-to-have) that gives the client a real budget decision rather than a take-it-or-leave-it number.
When should you hire an external estimator instead of doing it in-house?
In-house estimation works well when your team has done similar work before, has clean historical data, and the political stakes of the estimate are low. The calculus shifts when any of those conditions breaks down.
Criteria that favor external estimation:
Scale: projects above $500K where an estimation error of 20% represents a six-figure exposure
Novelty: first-time technology adoption (a new AI framework, a regulatory compliance system) where your team has no relevant analogs
Regulatory or security complexity: government contracts, HIPAA-covered systems, or financial applications where the estimate may be audited
Political stakes: internal projects where the estimating team also builds the system, creating an incentive to underestimate
Trade-offs:
External estimators cost money and time, but they bring calibrated models, independence, and defensibility that internal teams can’t always provide
In-house estimation is faster and cheaper, but it carries optimism bias and may lack the historical data depth that formal models need
A hybrid approach, where an external estimator reviews and validates an internal estimate, often delivers the best balance of speed, cost, and credibility
What to request from an external estimator: a documented WBS, the estimation method used, the inputs and calibration data applied, a confidence range (not just a point estimate), a risk register, and a clear statement of what’s excluded from scope. A number without those supporting documents is not an estimate; it’s a guess with a professional’s name on it.
Kreante’s estimation workshops produce bids you can defend
Getting a bid wrong in either direction is expensive. Underestimate and you absorb the overrun; overestimate and you lose the deal. Kreante’s estimation practice is built to avoid both outcomes for custom web and mobile application projects, from early-stage MVPs to enterprise platforms with AI components.
A typical engagement starts with a scoped discovery workshop: a structured session that produces a draft WBS, an assumptions log, and a calibrated estimate with 50th- and 90th-percentile numbers. For projects that include automation or AI features, the AI solutions team joins the discovery to scope the data and integration work separately, which is where most AI project estimates go wrong.
Startups preparing a first bid and enterprises validating a vendor’s quote both benefit from this process. Before a workshop, have your requirements document, any existing system documentation, and a prioritized feature list ready. Reach out through Kreante to schedule a discovery session and get a calibrated estimate you can take to a board or a client with confidence.
Start with a discovery session to capture requirements, then decompose the project into a WBS with tasks of 24–40 hours each. Apply three-point estimates to high-risk tasks, aggregate using the PERT formula, and validate against at least one historical analog before converting effort to cost.
The four core types are expert judgment, analogous estimation, parametric estimation (using models like COCOMO II or SLIM), and bottom-up (WBS-based) estimation. Most production projects use a combination of at least two.
Presenting both gives clients a realistic budget range rather than a single number that implies false precision.
Fixed-price works when the scope is well-defined, the WBS is complete, and the team has done similar work before. T&M is appropriate when requirements will evolve during delivery, as in Agile projects, where locking a price before the scope is stable transfers unreasonable risk to the vendor.



 Development