
 Development
SaaS Database: 4 Tests to Run Before You Commit
Prioritize tenancy patterns and validate your SaaS database with four tests: load, migration, cost, observability. Prototype on Postgres.
JorgeSeptember 3, 2026Read the article
Engineering focused guide to building analytics pipelines with replayability and ownership. Start with an audit and ship a validated prototype in weeks.

A data pipeline for analytics is the automated system that moves raw data from source systems, cleans and shapes it, and lands it somewhere your team can query, so dashboards, reports, and models run on numbers people actually trust. It works in three moves: ingest, transform, store. The hard decisions come later, in whether that motion runs on a schedule or in real time, and how much cleanup happens before the data lands versus after.
TL;DR:
Batch processing is more suitable for most analytics needs due to its lower cost, simplicity, and tolerance for hours of latency unless real-time insights are critical.
Ingestion should prioritize idempotency and robust connectors to handle schema changes, retries, and schema drift effectively.
ELT is generally preferred over ETL when working with warehouse-scale compute, but ETL remains necessary for governance, raw data preservation, and team-specific transformation skills.
The medallion architecture clearly defines raw, clean, and business-ready data layers, with lakehouse systems consolidating data lake and warehouse capabilities to simplify maintenance.
Building a pipeline involves starting small, validating its impact, and focusing on operational ownership and observability to ensure long-term trust and reliability.
Every analytics pipeline commits to a latency budget whether or not anyone decides it on purpose. Batch processing pulls data in chunks on a schedule, hourly, nightly, or weekly. Streaming processes each event as it happens, usually within seconds. Hybrid pipelines run both, using streaming for the metrics that need to be current and batch for the heavy, slower aggregations behind them.
A finance team closing the books overnight has no reason to touch streaming. Batch is cheaper to build, easier to debug (you can rerun a failed job and inspect the output), and forgiving of small delays. A fraud detection system, by contrast, is worthless if it flags a stolen card an hour after the purchase clears. That workload needs Kafka-style event streams and processing that reacts in near real time, per Apache Kafka’s own documentation on stream semantics and topic design.
The trade-offs stack up fast once you look past latency:
If you’re a small team without a dedicated platform engineer, default to batch until a specific use case forces your hand. Most analytics questions, revenue trends, churn cohorts, marketing attribution, tolerate hours of latency just fine. Reserve streaming for the handful of metrics where staleness actually costs money.
Every analytics data pipeline breaks into four layers, and each one carries its own operational contract. Vendor explainers from IBM consistently name ingestion, transformation, and storage as the backbone stages, with orchestration as the layer that keeps them honest.
Pro Tip: Build idempotency into ingestion before you build anything else. A pipeline that can safely rerun after a failure without duplicating data will save you more debugging hours than any dashboard feature you’ll ever ship.
ETL transforms data before it loads into the destination. ELT loads raw data first and transforms it afterward, inside the warehouse or lakehouse. Stripe’s own comparison of the two frames ELT as the default for teams with warehouse-scale compute, since cheap, elastic compute makes it wasteful to transform data twice, once on the way in and again when a business question changes.
That said, ETL still wins in specific conditions. Run through this checklist before defaulting to ELT:
A lot of production pipelines end up hybrid: land raw data untouched (ELT-style, for replayability), then apply light standardization before it’s queryable, and leave heavier business logic to modeling tools downstream. That pattern preserves your ability to backfill or reprocess history without losing anything.
The medallion architecture, Bronze, Silver, Gold, has become the default mental model for structuring an analytics pipeline, and it earns that status by giving every layer an explicit job. Bronze holds raw data exactly as it arrived, untouched and fully replayable. Silver applies cleaning, deduplication, and enrichment. Gold holds business-ready, aggregated tables that feed dashboards directly. This layering, documented in open-source medallion lakehouse implementations, lets you reprocess from Bronze if a transformation bug corrupts Silver, without ever touching the source system again.
Bronze equals raw and replayable. Silver equals cleaned and enriched. Gold equals business-ready and curated. That’s the entire operational contract of a medallion pipeline in three lines, and violating any one of them is usually where analytics trust breaks down.
A lakehouse tries to combine a data lake’s cheap storage with a warehouse’s transactional guarantees, ACID compliance and time travel among them, so you get one system instead of stitching a lake and a warehouse together with fragile sync jobs. That consolidation is why lakehouse patterns have displaced the older “lake plus separate warehouse” approach for a lot of new builds.
Lambda and Kappa architectures, which run separate (Lambda) or unified (Kappa) code paths for batch and streaming, still matter, but mostly for teams with genuinely demanding real-time requirements, think ad-tech bidding or fraud scoring, where the operational cost of running two processing paths is worth paying.
| Pattern | Strongest fit | Main drawback |
|---|---|---|
| Medallion (Bronze/Silver/Gold) | Analytics teams that need replay and clear data-quality gates | Requires discipline to keep layer boundaries honest |
| Lakehouse | Teams wanting lake economics with warehouse guarantees | Newer tooling; smaller talent pool than pure warehouses |
| Lambda/Kappa | Real-time-critical workloads (fraud, bidding) | Higher operational overhead maintaining dual/unified code paths |
Architecture gets you a working pipeline. Operations get you a pipeline people still trust six months later. Start with ownership: every producer, every Kafka topic, every curated table needs a named owner, and every interface between teams needs a versioned data contract that specifies schema and semantics so a producer can’t silently break a downstream consumer.
From there, the checklist that actually prevents 2 a.m. pages:
Pro Tip: Treat “is the pipeline running” and “is the data still correct” as two separate monitoring questions. A pipeline can hit every SLA on throughput and lag while quietly feeding a dashboard numbers that are wrong. Separate dashboards for platform health and data health catch problems the other one misses.
A workable analytics stack maps cleanly to the four layers above, and most production examples converge on similar tools. Open-source reference implementations, including the end-to-end pipeline example on GitHub, typically combine:
Managed alternatives trade setup time for a recurring bill. AWS documents Glue, Kinesis, and Redshift as a managed path through the same four layers, and Google or Azure equivalents follow similar shapes. Managed services cut the operational burden of running Kafka clusters or Airflow schedulers yourself, but the monthly cost climbs with data volume in a way self-hosted infrastructure doesn’t. For serving derived features or embeddings downstream, a system like Supabase with pgvector can be a lighter-weight option than a full warehouse when the use case is search or retrieval rather than heavy aggregation.
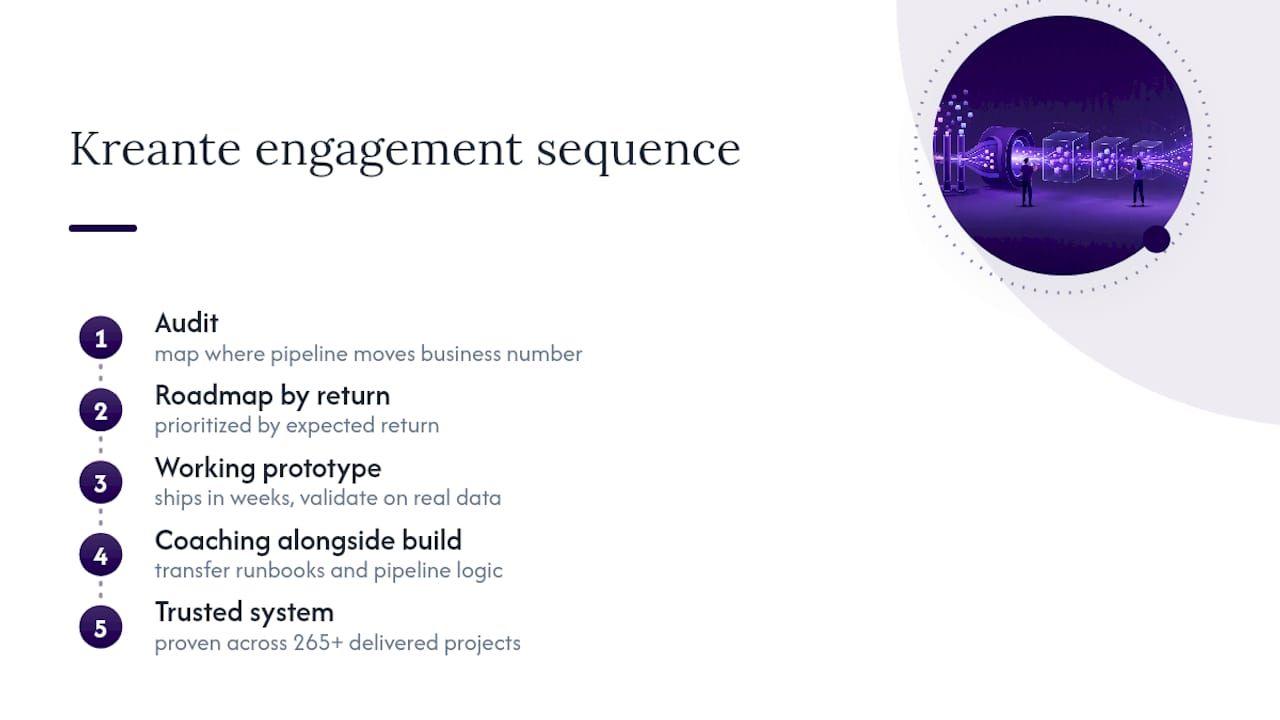
Kreante’s process for data and AI initiatives starts with an audit, mapping where a pipeline actually moves a business number before a line of code gets written. That audit produces a roadmap ordered by expected return, not a slide deck. From there, a working prototype ships in weeks, letting a team validate that the architecture holds up against real data before committing to a full build. Coaching runs alongside the build, so the pipeline’s logic and operational runbooks stay with your team, not with a vendor who walks away after launch. Across 265+ delivered projects, that audit-to-prototype sequence has consistently cut the time between “we think this pipeline would help” and a system your analysts actually trust.
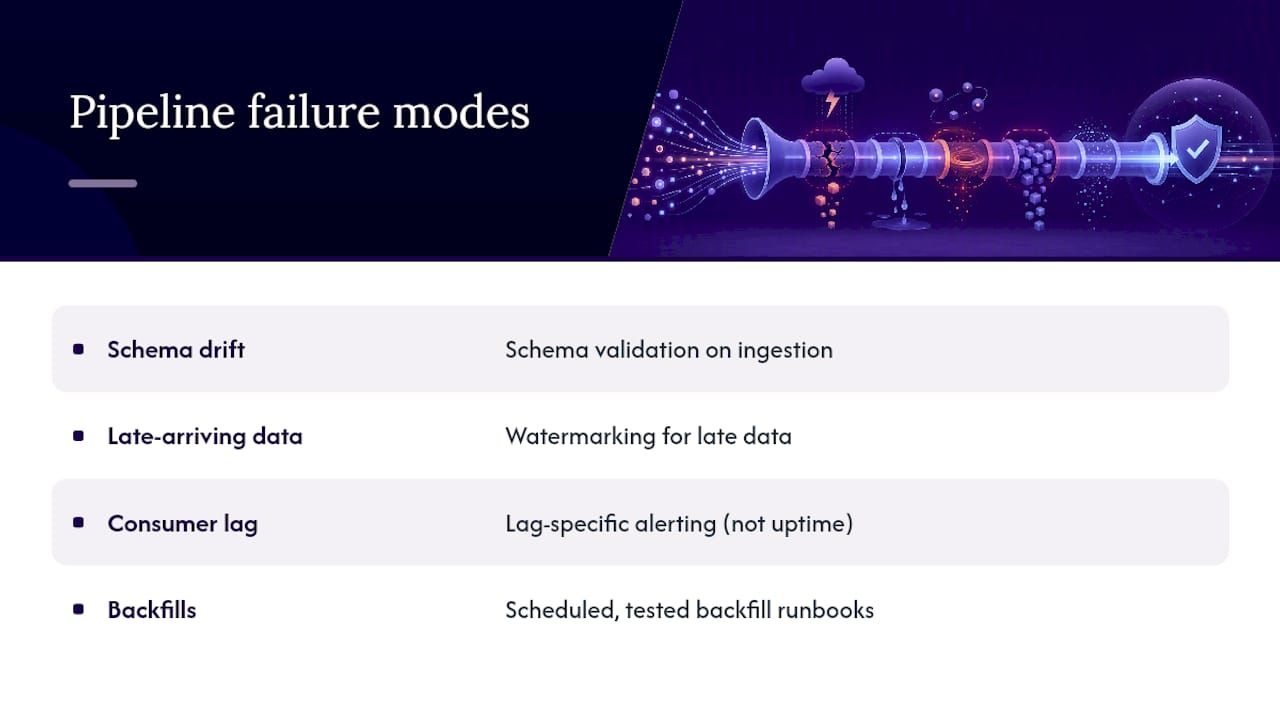
Most pipeline failures aren’t architecture failures. They’re maintenance failures that architecture alone can’t prevent. Schema drift is the most common one: a source system adds, renames, or retypes a column, and the pipeline either breaks loudly or, worse, keeps running while silently corrupting a downstream table.
Late-arriving data causes a subtler mess, especially in batch systems. An event tagged with yesterday’s timestamp shows up three hours after the batch job already ran, and your daily numbers are quietly wrong until someone notices a discrepancy in a monthly reconciliation.
Consumer lag creeping upward in a streaming system often goes unnoticed until it’s severe, because the pipeline still looks “up” on a basic health check while actual freshness degrades. And backfills, run rarely enough that nobody remembers the exact steps, tend to duplicate data or blow through cost budgets when the team attempting one hasn’t rehearsed it.
The fix for all four is the same discipline: schema validation on ingestion, watermarking for late data, lag-specific alerting distinct from uptime checks, and backfill runbooks that get tested on a schedule, not just written once and forgotten.
Build the smallest pipeline that answers one real question, then measure whether it changed a decision. Skip elaborate architecture until you can name the specific latency or governance problem it solves. After that, spend your next effort on observability and ownership, not new features. A pipeline nobody can debug at 2 a.m. isn’t finished, no matter how clean the dbt models look. If you need to validate an approach fast before committing engineering months, that’s exactly when a rapid prototype from an outside team earns its cost.
— Jorge Del Carpio
An alternative to hiring a full data platform team from scratch is to start with an audit and working prototype achievable in weeks instead of a multi-quarter build with no proof it’ll pay off. Where a from-scratch hire means months of ramp-up before anyone touches production data, an alternative process starts with an audit, a return-ordered roadmap, and delivery of a working prototype before full build commitment.
What that looks like in practice:
If your team is stuck deciding between building a pipeline in-house or bringing in help to move faster, start with an audit conversation and get a roadmap with a number attached, not a guess.
Start with Apache Kafka’s documentation for streaming semantics, TechTarget’s data pipeline overview for foundational concepts, and IBM’s explainer on core stages. For the ETL/ELT decision, Stripe’s guide is the clearest breakdown available. Study the medallion lakehouse repo and the end-to-end pipeline example for deployable reference code, and check AWS’s managed-service overview if you’re weighing managed versus self-hosted.
A data pipeline is the broader system that moves data from source to destination, covering ingestion, transformation, storage, and orchestration. ETL is one specific pattern within that system, referring to transforming data before it loads, as opposed to ELT, which transforms it after loading.
A common example ingests events through Kafka, processes them with Spark, lands raw data in S3 or MinIO storage, models it into business-ready tables with dbt, and schedules the whole sequence with Airflow, the same stack demonstrated in open-source reference pipelines.
Most analytics pipelines move through source identification, ingestion, cleaning and transformation, storage, analysis or modeling, and finally delivery to dashboards or reports, with monitoring running continuously across every stage to catch quality issues before they reach analysts.
Yes. Python is one of the most common languages for writing ETL and ELT logic, often paired with libraries like pandas or PySpark for transformation and Airflow for scheduling the jobs that run that code.
Default to batch unless a specific use case, like fraud detection or live operational alerts, requires data fresher than an hour old; batch is cheaper to build, easier to debug, and sufficient for most analytics questions.
Go further
Don't let your tech watch stop here. Explore our other resources to master your technology stack.
DevelopmentPrioritize tenancy patterns and validate your SaaS database with four tests: load, migration, cost, observability. Prototype on Postgres.
 Development
Developer focused review of AI agent frameworks for production: graph vs loop tradeoffs, observability, governance, and how to prototype in weeks.
 Development
Framework-fit mobile CI/CD guidance for engineering teams. Learn when to choose managed, general, or self hosted setups and follow a 3 stage checklist to...