
#01
It brings your sources together
CRM, ERP, accounting, shared files: the data is gathered in one place and updated automatically, with no manual exports.

Sales in the CRM, stock in the ERP, margins in a spreadsheet only the financial controller knows how to update… and every Monday, the same question at the management meeting: “Why did revenue drop in the West?”. The answer is almost always in your data, as long as you can ask it. Our approach at Kreante is simple: before talking about AI, we put your data in order. Once your sources are brought together and made reliable, you can query your figures in plain language, follow dashboards that explain what is changing, and rely on solid forecasts. It all connects to your current tools. Reporting stops being a chore, and your teams get time back to make decisions.
265+ projects delivered in 35 countries · 4.9/5 average rating on Clutch · more than 8,000 properties analysed every day for DAVCO AI

















Does this ring a bell?
A monthly report that takes three days to prepare, and is already out of date the day it is presented
Exports copied and pasted from one piece of software to another, with a broken formula somewhere
A simple question, such as “which customers cut their orders this quarter?”, waiting a week for an answer from the only colleague who can write the query
Well-designed dashboards that nobody opens any more
Sales forecasts made by guesswork, or almost
A “Monthly_reporting_V12_DO_NOT_TOUCH.xlsx” file that everybody touches
According to Insee, 29% of companies not yet using AI cite difficulties related to their data, and lack of expertise remains the main obstacle for those that do use it[1]. That is often where everything is decided. An AI plugged into scattered or inconsistent data will answer you very quickly, but not necessarily correctly. That is why we always start by making your data reliable.
CRM, ERP, accounting, shared files: the data is gathered in one place and updated automatically, with no manual exports.
Duplicates, different date formats, the same customer written three ways: inconsistencies are corrected, or flagged when a person needs to decide.
You type your question in plain language. AI turns it into a query, the database does the calculation, and you see both the result and how it was obtained.
A drop in sales? AI looks for where it is concentrated, by product, region or customer, and suggests leads for you to check.
Based on your history, it forecasts your sales, your stock needs or your cash flow, and alerts you as soon as an indicator moves away from normal.
AI informs the decision, and you are the one who makes it.
Every week you get a clear view of the business, and you ask your questions as soon as they come up.
Your customer data says a lot, as long as you cross-reference it.
Less time consolidating, more time analysing. Reconciliations happen on their own, and your team focuses on the variances.
You don’t necessarily need a custom project. An AI assistant is sometimes enough to analyse a one-off file, and a well-configured dashboard tool does the job very well in many companies. If that is your case, we will recommend it without hesitation.
| Approach | What it does well | Its limits | Ideal for |
|---|---|---|---|
| AI assistant on a file | Quickly analysing an export or an Excel sheet | Data copied by hand, no tracking over time, confidentiality to watch | A one-off analysis, on non-sensitive data |
| Dashboard software | Tracking predefined indicators, shared by the whole team | Per-user licence, questions limited to what was planned | Regular reporting, on sources that are already clean |
| Custom solution | Bringing all your sources together, answering open questions, forecasting | Requires scoping and work on data quality | Scattered data and questions that change often |
Already using Power BI or another dashboard tool? We simply build on it, and your teams keep all their bearings.
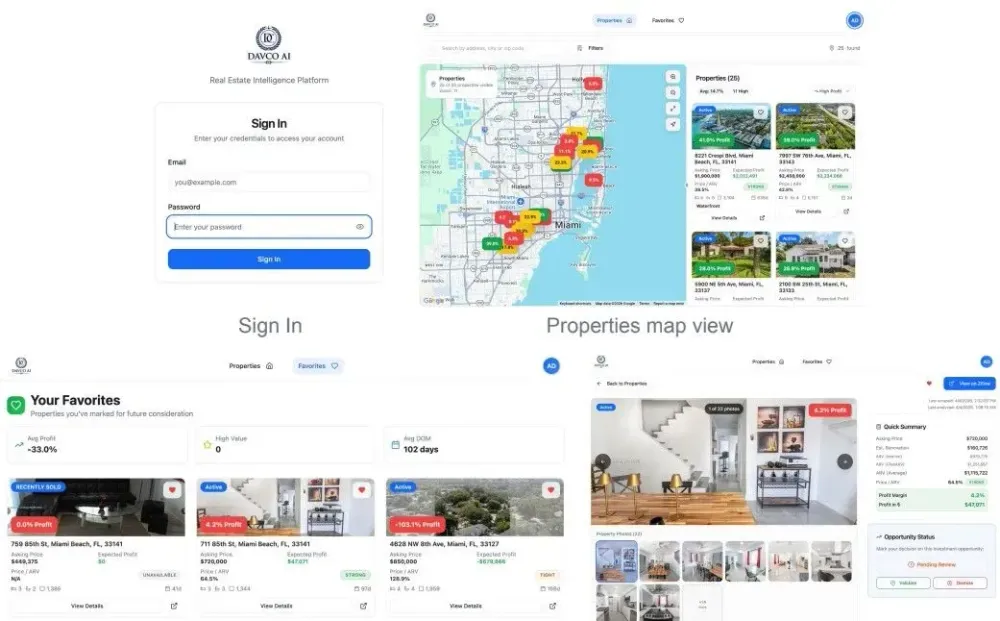
For a team of investors based in Miami, we developed a platform that analyses more than 8,000 properties every day. Listings are collected automatically, AI estimates renovation costs and the property’s after-repair value, then the potential margin of each opportunity is shown on a map. The mobile app and the analysis engine were delivered in three months.
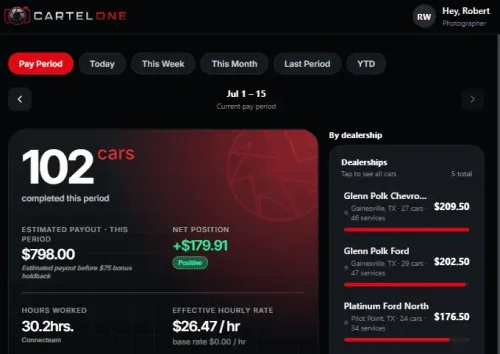
AutoCartel photographs dealers’ vehicles across 10 US markets. Its teams had no visibility of their photographers’ performance. We connected their time-tracking and production software, then built views by market and a ranking of photographers by effective hourly rate. Here, reliable connections and automated calculations were enough, and that is exactly what we delivered.
Revenue per customer, margins, salaries, contact details: your data is among the most sensitive information in your company. Entrusting it to AI calls for a few precautions, starting with the simplest: never upload a customer file to a free online tool.
AI has also created new risks, often where you least expect them. Take a very common example. A well-meaning employee asks AI to build them a sales dashboard. The result looks great, they share it with a simple link… and your margins per customer become accessible to anyone who gets hold of that link. Meanwhile, hackers use AI too, to write very convincing fake emails or to find the weakness of a poorly protected tool in no time. That is why every solution we deliver is reviewed and tested by our senior developers before going live.
Protected sharing links, with every view logged
Your data is hosted in Europe and is never used to train public models
Everyone only accesses what concerns them: a sales rep sees their sales, not the salaries
Personal data is kept to the strict minimum, and no important decision about a person is left to AI alone, as recommended by the CNIL[2]
We first look at where your figures come from, how they are entered and where they contradict each other.
A well-built dashboard, an automation, or an AI model when it really adds something: we choose according to your needs, and we explain why.
Every answer shows its calculation and its sources. You know where the figure comes from, and you can defend it to your banker or your board.
CRM, ERP, accounting or Power BI: our solution connects to them and works in the background. Your teams keep their habits.
Scope and budget are set in writing before we start. The code is yours, with no per-user licence, even when the whole company looks at the dashboards.
We started out with Bubble, WeWeb or Xano. Today we work with Cursor, Codex and Claude Code, on proven foundations such as PostgreSQL, Supabase and Python. To develop, we rely on our own AI agents, always under the supervision of our senior developers. Your first version is ready in a few weeks.
Free
30 minutes with an expert
Custom quote
An inventory of your data, then a costed roadmap
Fixed price, custom quote
Scope and budget approved in writing before we start
We start from the decisions you make and the questions you ask yourself, rather than from the data available.
We take stock of your data, measure its quality and identify what needs fixing.
Our AI agents develop it, our senior developers steer and approve every step.
A team uses it day to day, and we compare its figures with your usual reporting to check that they match.
New sources, new departments, new questions, at the pace of the results.
Procedures, contracts, meeting notes: your teams can also query them in plain language.
Hands-on sessions to learn how to ask your data the right questions, and how to check the answers.
Challenge
Stack
Performance and payroll management platform for AutoCartel field photographers.
Challenge
The platform ingests property data daily via Zillow scraping, runs AI-driven renovation cost and ARV estimates using OpenAI, and surfaces the highest-potential deals first. Users can review…
Stack
An AI-powered real estate intelligence platform built for a Miami-based investment team. DAVCO AI replaces manual Zillow filtering and spreadsheet-based calculations with an automated map interface that displays estimated profit margins across all active single-family listings in the Miami area.
Challenge
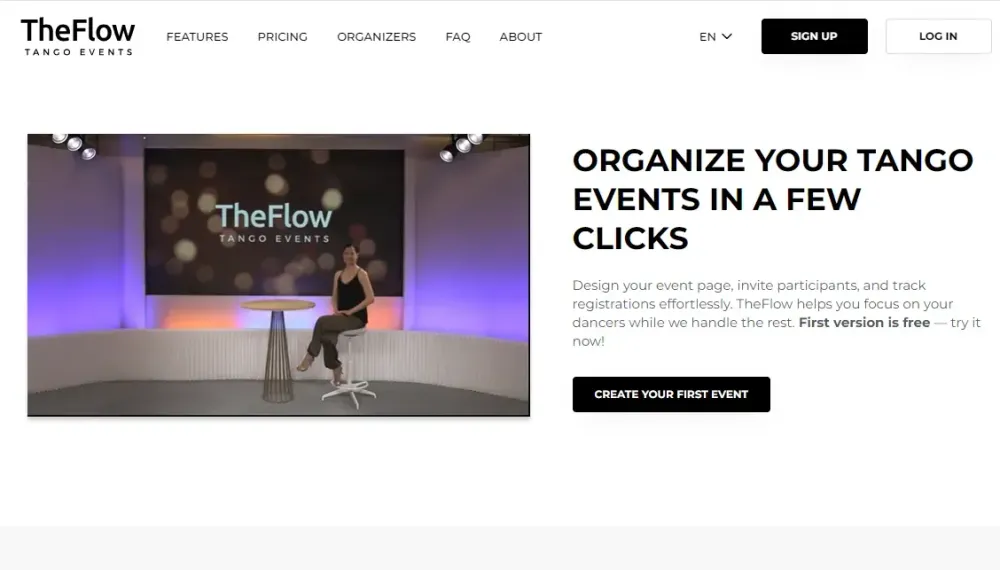
Tango event organizers across Europe were running everything manually — registrations, confirmations, payments, check-in. They needed one purpose-built platform to manage the full event lifecycle,…
Stack
TheFlow is a web platform built for tango event organizers in Europe. Kreante evolved it across multiple phases from a basic registration tool into a complete event management and ticketing product — covering event creation, participant management, waitlists, online payments, QR check-in, automatic invoicing, and an international tango event calendar.
Challenge
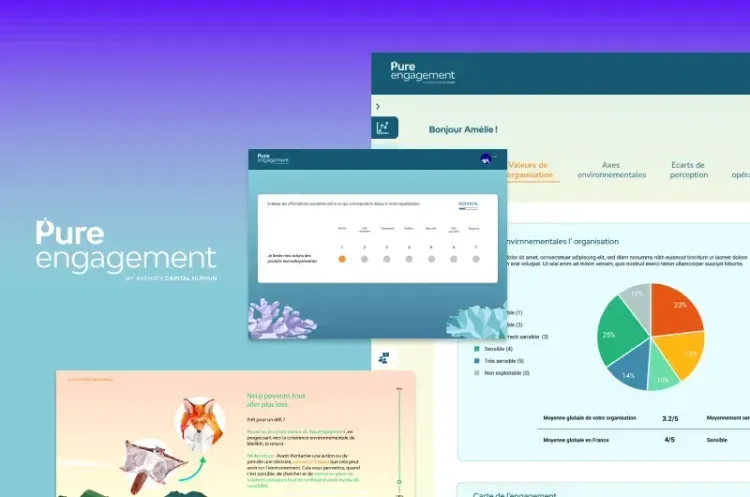
Kreante developed a comprehensive platform for Pure Engagement using NoCode technologies. Built with Bubble for the frontend and Xano for the backend, this solution facilitates organizational…
Stack
Pure Engagement needed a platform capable of handling the complexity of organizational transformation, recognizing that success depends not only on structural change but also on people’s psychological and emotional transition.
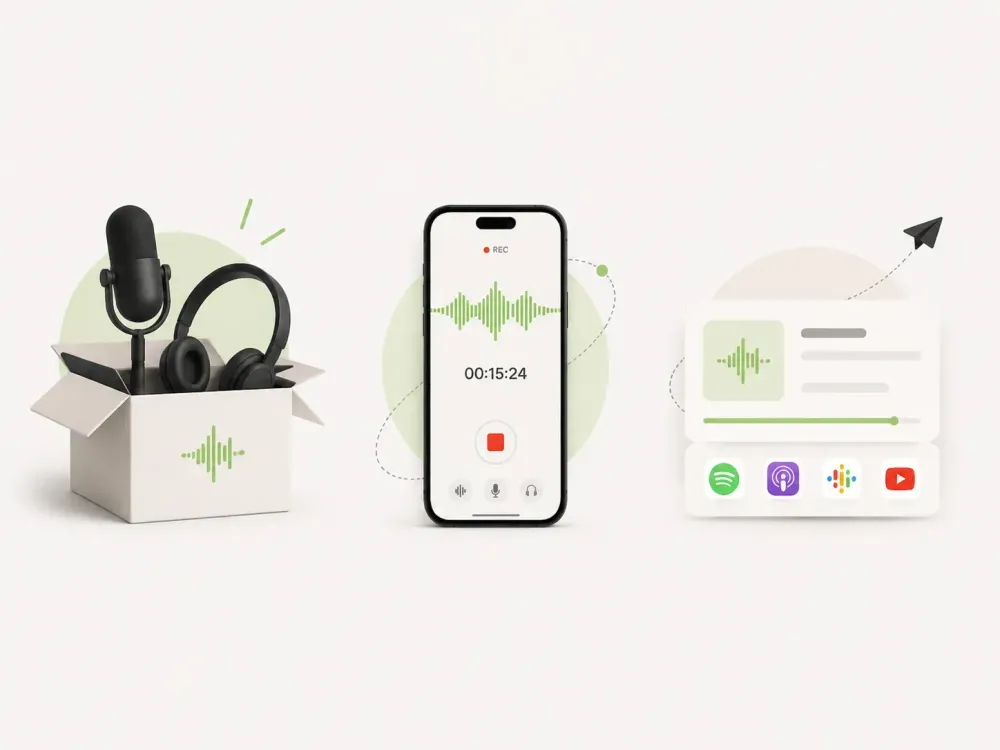
Challenge
Build an iOS app that turns iPhones plus an audio interface into a complete, professional podcast recording studio, capturing high-quality sound and video across several phones at once and keeping…
Stack
A mobile app that lets creators record, sync, edit, and export podcast audio and video using a dedicated interface and multiple iPhones working together as one studio.
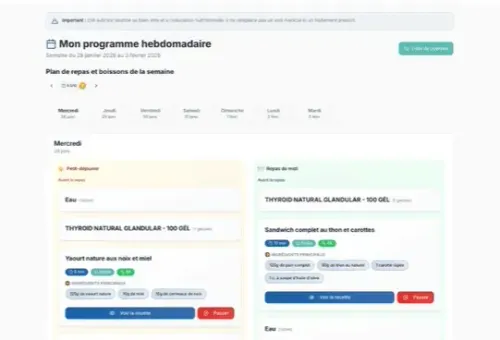
Challenge
Patients leaving clinic checkups with a list of medical recommendations and lab results often had no clear, practical way to turn that information into daily meals, leading to poor adherence and high…
Stack
Kreante built REMI AI, a system that reads a patient's genetic and medical test results and automatically turns them into a personalized nutrition and supplement plan that gradually evolves over several months, with clinic staff reviewing every AI-generated interpretation before it reaches the patient.
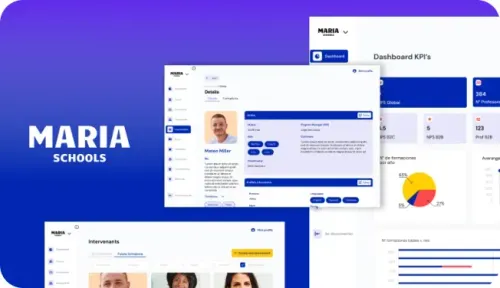
Challenge
Stack
In the evolving landscape of web development, choosing the right approach for custom software development is crucial.
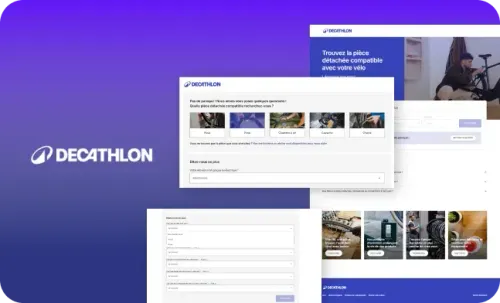
Challenge
Stack
In the sustainability-focused retail landscape, product repair and maintenance play a pivotal role in circular economy initiatives. Businesses are increasingly adopting innovative solutions to reduce waste and extend product life cycles.

Challenge
Stack
When Garde-Robe presented their innovative vision to make fashion more social and collaborative, Kreante, a leading LowCode agency, eagerly embraced the challenge.
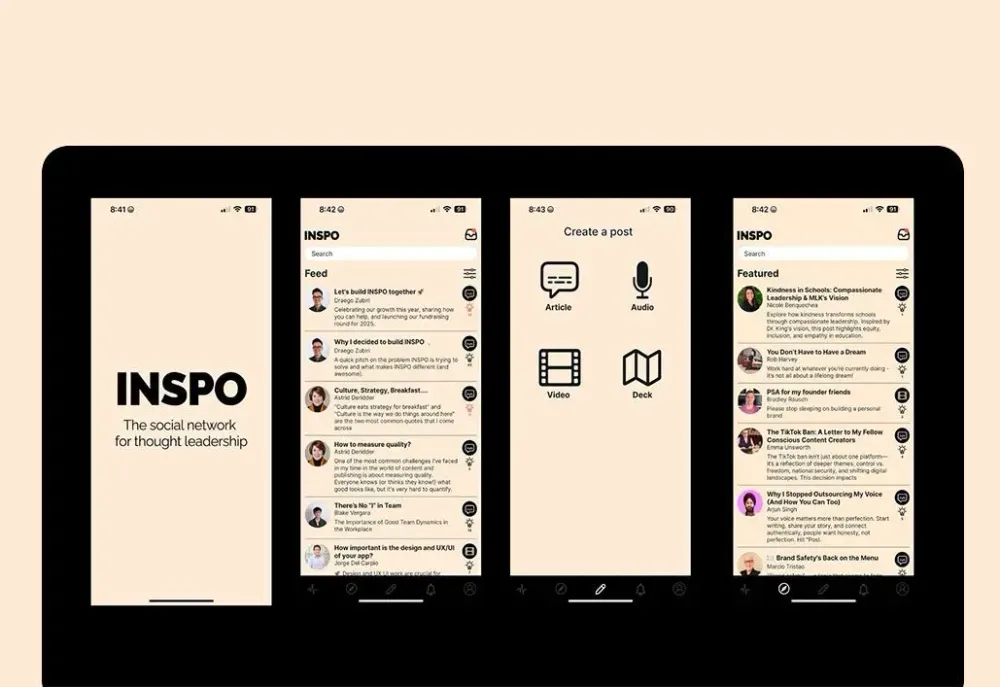
Challenge
When INSPO approached our LowCode agency with their vision of creating the definitive platform for thought leadership, we knew this project would push the boundaries of what’s possible with…
Stack
In the rapidly evolving landscape of LowCode development, creating sophisticated applications no longer requires months of traditional coding.
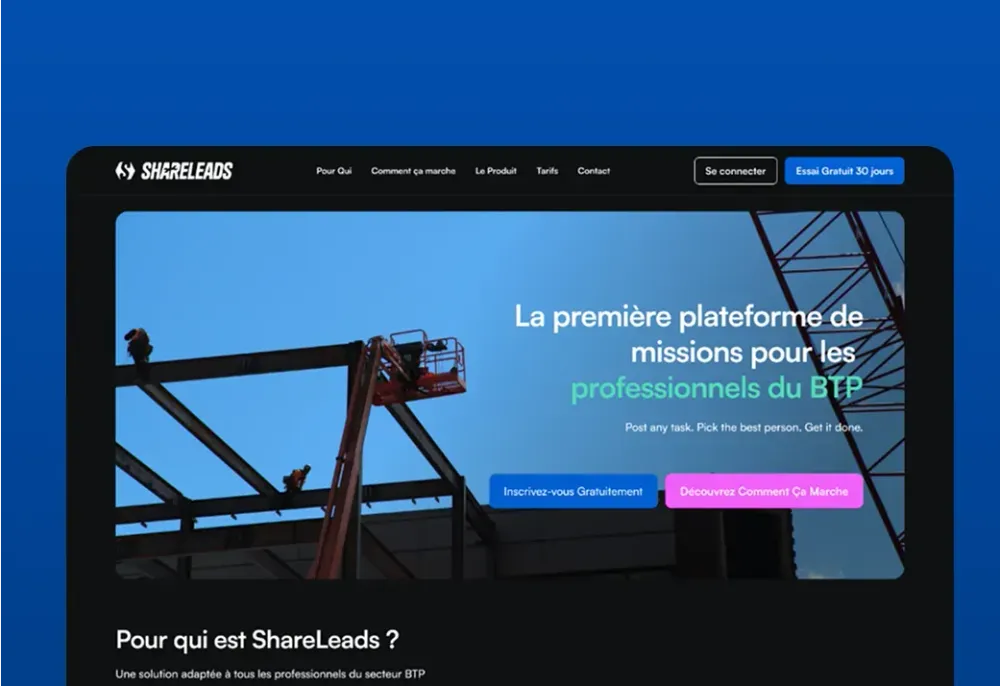
Challenge
Stack
Connect with verified construction professionals, find new projects, recruit subcontractors, and grow your business with ShareLeads' trusted B2B platform.
Challenge
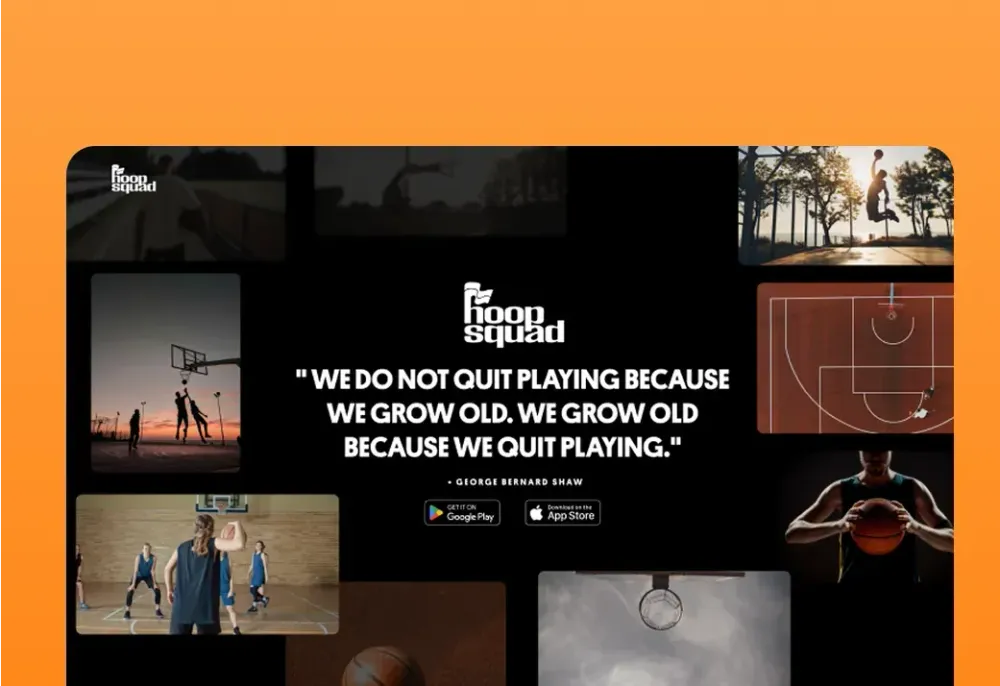
The basketball community in Washington D.C. lived on courts and in scattered WhatsApp groups. What was missing: a place to give it visibility, bring more people together, find players at your…
Stack
What we built In 3 months, Kreante delivered all three platforms at once. The mobile app lets you find pickup games within a 10-mile radius, rate players to compete at the right level, track your progress, and meet up to watch games together. Two tiers: a free version and a premium subscription at $39.99/season — proof that the community is willing to pay to play better. For this kind of project, visual identity isn't just a detail — it's what creates the sense of belonging from the very first open. The entire branding was conceived and built by Kreante. The landing page was built to convert: a strong visual world, a clear message, one goal — trigger the download. The e-commerce store pushed the logic even further: unapologetic street style, rooted in DC culture, to rep your colors beyond the court. Launched at a Virginia tournament, HoopSquad is now live across 13 regions in the United States — on the App Store and Google Play.
Challenge
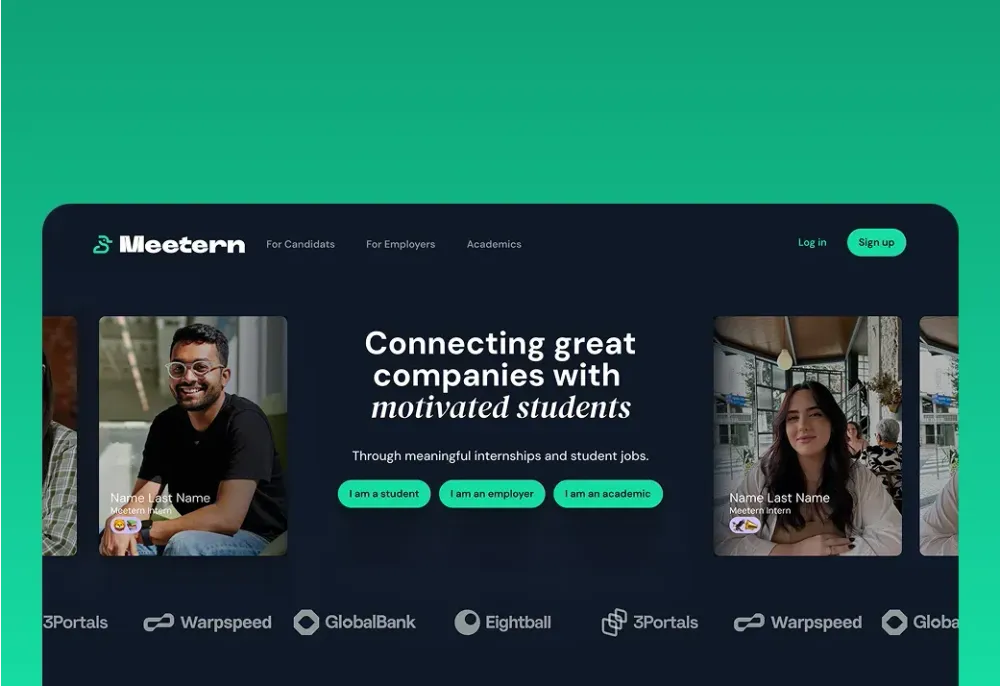
The Meetern team had been connecting students and companies for years, through physical events. Many great encounters and opportunities later, they understood that to create real impact at scale,…
Stack
What we built Kreante designed and developed Meetern: a complete matchmaking platform, with three distinct interfaces for students, companies, and academic institutions. Students build their profile, apply, and track their applications. Companies post opportunities and receive intelligently matched profiles. Academic institutions monitor placements in real time. Across all three: integrated messaging and a matching algorithm that replaces manual introductions. The platform is multilingual, French and English at launch, Dutch on the way. A V1 delivered in 6 months, a V2 launched in March 2026 with extended language support. Today, 50 to 100 active users every day. And a team that no longer runs events, but a platform.
Challenge
Every manager knows a motivated team performs better. But motivation is invisible. And without understanding what truly motivates each person, engagement initiatives remain educated…
Stack
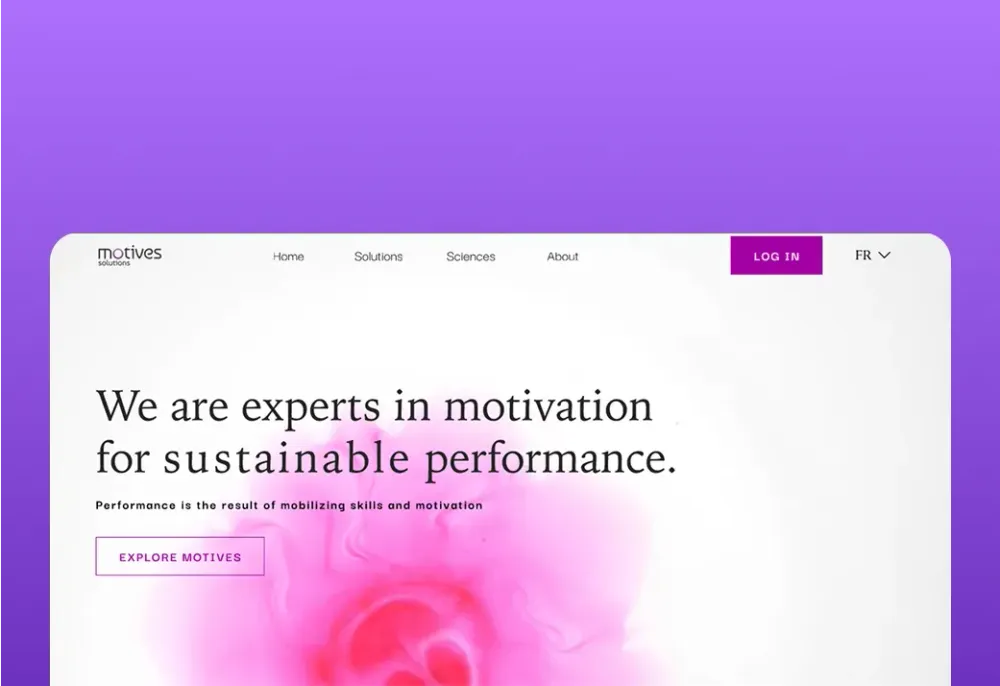
Kreante designed and developed Motives Solutions: a bilingual SaaS platform (FR/EN), from branding to application. Team members answer 3 anonymous questions. The app analyzes responses and generates a detailed report by motivational driver, for each individual, each team, each organization. Two modules: Motives TEAM for team-level insights, Motives ORGA for the full picture. Tracking is longitudinal: engagement evolution over time, visualized. Three questions. A clear picture of what truly moves a team forward. Measuring the invisible, so you can finally act on it.
Challenge
After a decade training thousands of women for tech jobs, Laboratoria saw its graduates stall on the way to leadership: in engineering and product, only 52 women are promoted to management for every…
Stack
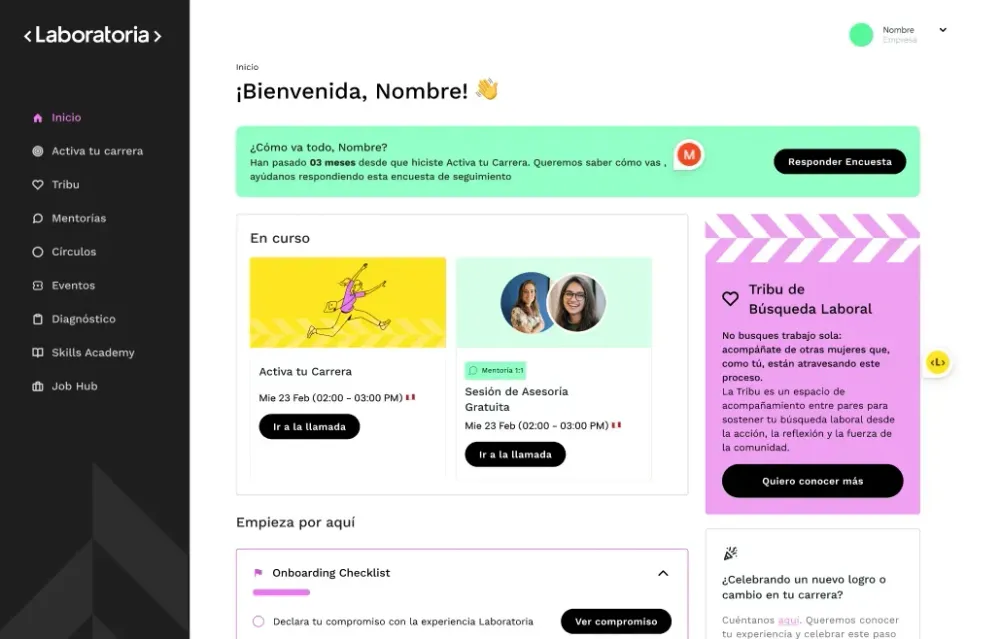
Laboratoria+ is the membership platform of Laboratoria, the Latin American organization that has helped more than 14,000 women access quality jobs in tech. Built with Bubble, it brings together live courses and learning circles, 1:1 career mentoring with a network of senior women executives, online and in-person events, and a free plan alongside paid Pro and Plus subscriptions.
Challenge
Stack
Transform your organization with ROC's secure hyperautomation platform. Orchestrate workflows, governance, and access management from a living organizational chart.
Challenge
Class2Class wanted any teacher in the world to find a partner class and run a real project together, but international collaboration in schools depended on personal contacts, scattered tools and…
Stack
Class2Class is a global learning community, based in Denmark, where teachers connect their classrooms to run real-world projects around the UN Sustainable Development Goals. Kreante rebuilt the web platform with Bubble and Xano — teacher profiles, class matching, project creation and collaboration spaces — and delivered the rebranding and landing page. The community now counts more than 25,000 teachers in 190+ countries.
Challenge
In Switzerland as across the world, independent cab drivers face the same reality: ride-hailing platforms that set the rates, impose the rules, and own the client relationship. Olivier Fouvy wanted…
Stack
SmartCab is built on a radical premise: for the end customer, nothing changes. No new app to download, no account to create, no interface to learn. They send a WhatsApp message to their driver, just as they always have. Behind that message, an entire machine kicks into gear: an AI engine processes the request, calculates the route, confirms the booking, and triggers invoicing — automatically. Everything an app does. Without the app. They send a WhatsApp message. The rest happens without them. For drivers, it means freedom regained: customizable pricing, a client relationship that belongs to them, no algorithm to appease to stay visible. For fleet operators, a dispatch module handles ride assignments and real-time driver tracking. Three subscription tiers: Lite, Pro, Premium — built for every profile. What SmartCab proves is that real sophistication doesn't announce itself. It's felt — in a booking that requires zero effort, in a relationship of trust that no one gets to monetize. Available on iOS and Android.
Bring the one that has been on your mind since the last management meeting. In 30 minutes, we look together at whether your data can answer it, and what it would take to get there. It is free and without commitment.
It is the use of artificial intelligence to explore your data, spot trends and answer your questions. Where a traditional dashboard shows predefined indicators, AI lets you ask an open question and get a tailored answer[5]. It relies on several techniques, from machine learning for forecasts to language processing for analysing texts such as customer reviews.
There are four levels, from the simplest to the most advanced[5]:
| Type | The question | Example | What AI brings |
|---|---|---|---|
| Descriptive | What happened? | Quarterly revenue, by region | Reporting prepared and commented automatically |
| Diagnostic | Why did it happen? | The drop in sales in the West | Variances identified and likely causes suggested |
| Predictive | What will happen? | Sales over the next three months | Forecasts that take your history into account |
| Prescriptive | What should be done? | The products to restock first | Recommendations, which you approve |
Most companies already master the first level. AI makes the other three accessible, without needing a team of data scientists.
It all depends on your data and what you want to do with it. Here are the main families of tools[6]:
| Type of tool | Use | Examples | Watch out for |
|---|---|---|---|
| General-purpose assistant | Analysing an Excel or CSV file, creating a chart | ChatGPT, Claude, Gemini | Never sensitive data in the free version |
| AI built into the spreadsheet | Formulas, pivot tables and charts on request | Copilot in Excel, Gemini in Sheets | Check the formulas suggested |
| Dashboard software | Shared indicators, reports and visualisations | Power BI, Tableau, Qlik | Per-user licence |
| Conversational analysis tool | Large files, statistical analysis | Julius, Powerdrill | Check pricing and terms |
| Questions to a database | Turning a question into an SQL query | BlazeSQL | Queries to check on critical data |
| Custom solution | Bringing your sources together, answering and forecasting | An agency like Kreante | Requires initial scoping |
Several tools let you get started without spending anything:
Keep one rule in mind: in their free versions, these assistants may reuse what you give them to train their models[8]. So keep them for public or anonymised data.
Yes, provided you know how they were obtained. An AI assistant does not work like a spreadsheet: it writes its answer word by word. If it gives a figure without actually calculating it, that figure may be plausible… and wrong, especially on a large file it has not read in full.
Fortunately, recent assistants can run calculations when you give them a file, but this is not always visible. The right reflex: ask it to show the formula, code or query it used, and check one or two totals yourself. In the solutions we develop, every answer shows its calculation and the data used, so you can check it.
Predictive AI uses your history to estimate what is likely to happen. A few telling examples in business:
One limit to be aware of: a forecast assumes that the future looks a little like the past. It will not see a crisis or the sudden loss of a major customer coming. It will, however, alert you very early when reality starts to diverge from it.
Yes. It can run regressions, statistical tests, customer segmentations or time series, writing the necessary code itself. What used to require Python or R skills becomes accessible in a few sentences.
Interpretation, however, remains your job. Correlation is not causation, and AI knows neither the context of your figures nor the promotion launched last month. Always ask it to detail its method and assumptions.
No. That is precisely the point of AI: a manager, a sales rep or a financial controller can query the data themselves, in plain language. You do, however, need someone who knows your figures well and becomes their point of reference: they know where they come from, validate the definitions, such as what counts as an “active customer”, and spot when something is off.
No, but it changes their job. It takes over data preparation and repetitive queries, which take up a large part of their days. Analysts then spend more time on what has the most value: understanding the business, choosing the right indicators, interpreting the results and convincing decision-makers.
Two texts mainly govern these uses:
The answer depends less on the AI itself than on the state of your data. If your figures are already neatly organised in a single piece of software, preparation will be quick. If they are scattered across five Excel files that don’t all say the same thing, you will first need to put them in some order. Three factors affect the budget:
To compare transparently, also think about licences. Dashboard software is paid for every month, for every user.
At Kreante, every project is priced at a fixed rate on a written scope, and you own the code.
The market brings together dashboard software vendors, conversational analysis tools and agencies that design custom solutions[6][9].
| Solution | Type | Positioning |
|---|---|---|
| Kreante | Custom solution | Analysis connected to your own tools, from making data reliable to forecasting, with no per-user licence. 265+ projects delivered in 35 countries, 4.9/5 on Clutch |
| Microsoft Power BI | Dashboards | Reports and dashboards, with Copilot to generate visuals, for companies using Microsoft 365 |
| Tableau | Dashboards | Advanced visualisation, with Tableau Pulse to track trends and forecasts |
| Qlik | Dashboards | Analytics and dashboards with built-in AI features |
| Julius | Conversational analysis | Analysis of files and datasets through conversation |
| Powerdrill | Conversational analysis | Analysis of files and documents, with a free plan |
| BlazeSQL | Questions to SQL | Plain-language questions turned into queries on your databases |
This list is not exhaustive.

Written by Jorge del Carpio, CEO and co-founder of Kreante. Since it was founded in 2020, the agency has delivered 265+ projects in 35 countries.
Published Updated
From the blog
Guides, comparisons and field notes from the projects we deliver.
 Insights & Tips
8 KPI dashboard examples with copyable card templates and design rules. See how fast prototypes and low code AI build real dashboards your team will use.
 Development
Engineering focused guide to building analytics pipelines with replayability and ownership. Start with an audit and ship a validated prototype in weeks.
 Tools
Get a practical implementation plan for analytics for SaaS: a 90 day roadmap, a 5 to 7 metric scorecard, and clear criteria to decide whether to build or...
 Tools
Pick Lovable to get a hosted, Supabase backed live app fast. Pick Claude Design when engineering teams need code first prototypes and tighter code control.
 Development
Most AI automation projects show no measurable result. A Kreante project manager explains the sequence that works, with pricing and a real case study.
 Development
Pilot AI coaching for one to three teams over 6 to 8 weeks, measure workflow KPIs, and demand embedded deliverables to keep skills in house.